Sailgene Technology

Genome Survey Analysis: Three Key Parameters You Must Know Before Starting Your Next Genome Project
Release time:2026-06-11 08:49:34
Before you invest heavily in sequencing a new species, do you know its genome size, heterozygosity, repeat content or ploidy? Guessing can lead to wasted budget, failed assemblies, and wrong tool choices. This guide helps you understand what a genome survey analysis can do for you and introduces our one‑stop service to get it done efficiently.
1. Are You Really Ready to Start a New Genome Project?
Have you ever run into these situations?
-
You know nothing about the genome size of a new species. How much sequencing data should you order?
-
Your sample might be highly heterozygous or repeat-rich. Will standard assemblers work?
-
You suspect polyploidy but aren’t sure which assembly strategy to choose?
If you just sequence with “rule of thumb”, you risk:
-
Insufficient depth leads to fragmented assembly and missing key genes.
-
Excessive depth leads to wasted budget and longer turnaround.
-
Wrong assembler leads to unusable results when a diploid assembler is used on a polyploid gives unusable results.
A simple solution is perform a genome survey analysis (also called genome profiling) before investing in full-scale sequencing. With just a small amount of data, you can estimate genome size, heterozygosity, repeat content and ploidy – a roadmap for your entire project.
2. Our Solution: 30-50× NGS Data + k-mer Analysis to Estimate Three Core Parameters
Core method: k-mer frequency distribution analysis
-
Platform: NGS (Illumina or DNBSEQ), 30-50× depth
-
Cut sequencing reads into short fragments of length *k* (usually k=19) (Fig. 1).
-
Count how many times each kmer appears and plot the frequency histogram.
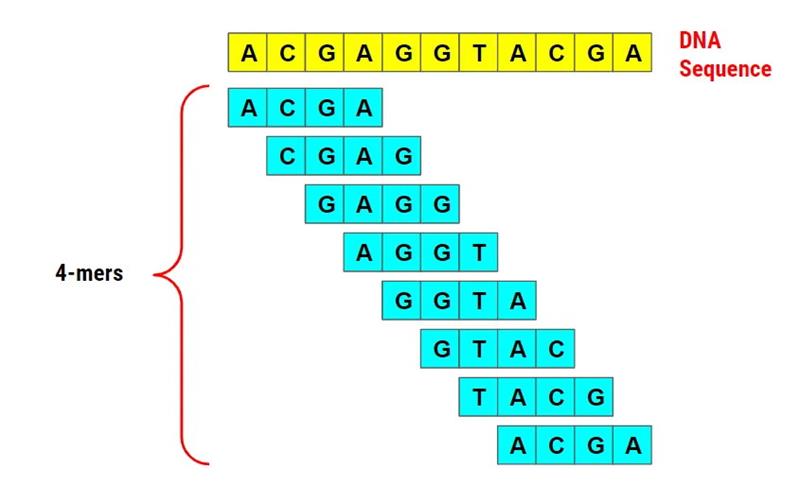
Figure 1. 4-mer example from the ACGAGGTACGA sequence.
(Source: https://medium.com/swlh/bioinformatics-1-k-mer-counting-8c1283a07e29)
From this plot we obtain (Fig. 2):
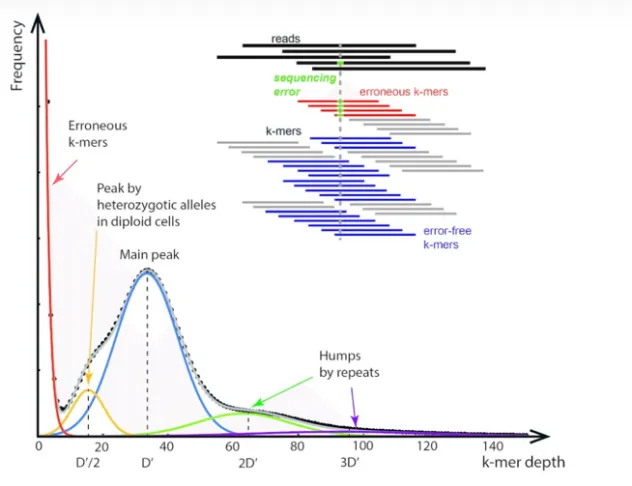
Figure 2. Schematic diagram of k‑mer frequency distribution.
(Source: http://www.zhangzhiyuan.site/archives/kmer-ping-gu-ji-yin-zu-da-xiao)
With only 30–50× short-read data, you get a complete blueprint for your project.
3. How to Do It: Platform Recommendations + Handling Unknown Genome Size
a.Platform & Depth Recommendations
-
Platform: Illumina or DNBSEQ (pairedend, 150–300 bp insert)
-
Recommended depth: 30–50× (suitable for most animal/plant genomes)
-
Library type: short-insert library (~350 bp)
b.What If the Genome Size Is Completely Unknown?
You can estimate it in two ways:
Method 1. Search related species
Visit public databases for genome sizes of closely related species:
-
NCBI Genome Database
-
Ensemble
-
Plant DNA Cvalues Database (plants)
-
Animal Genome Size Database (animals)
Method 2. Experimental estimation
Use flow cytometry or Feulgen densitometry to directly measure nuclear DNA content. This is the most reliable pre-estimation method.
If you are unsure how to proceed, we can help with database searches or arrange flow cytometry services.
4. Case Study Gallery: Real k-mer Plots of Diploid, Triploid, Tetraploid and Hexaploid Genomes
By looking at the shape and peaks of a kmer distribution plot, you can quickly judge the ploidy and complexity of your species. The following k‑mer distribution plots illustrate characteristic patterns observed in diploid, triploid, tetraploid and hexaploid genomes. All results presented here were analyzed using GenomeScope2 (2) with data from previously published studies (see references).
Case 1. Diploid Genome – One Major Peak
Example: Unio delphinus (freshwater mussel)(1)
-
Genome size: 2.31 Gb
-
Heterozygosity: 0.64%
-
Repeat content: 46.8%
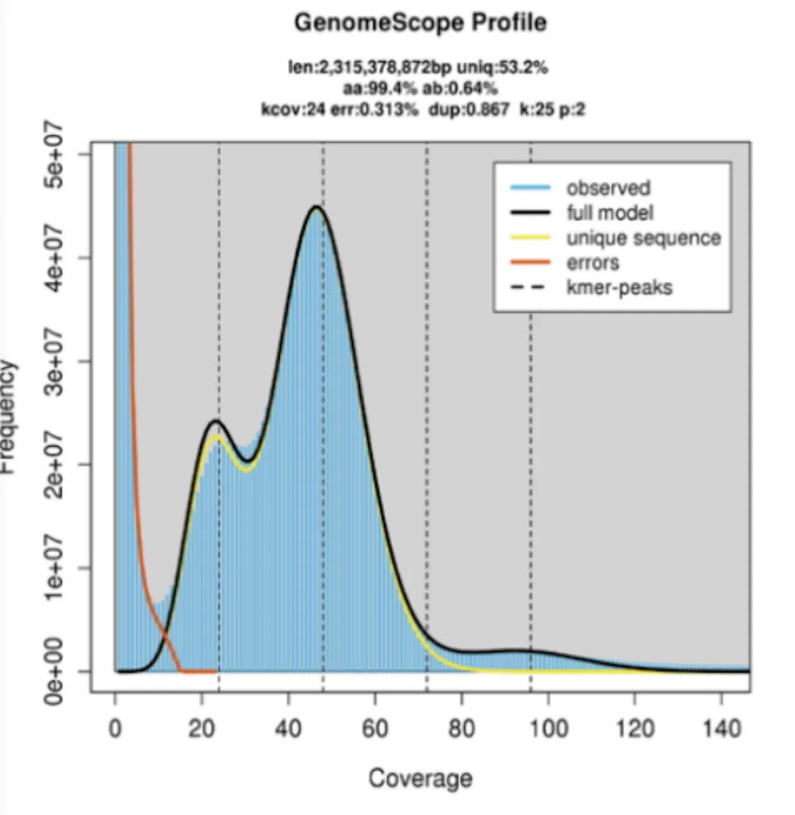
Figure 3. Diploid k‑mer plot of Unio delphinus (k=25).
(Source: https://doi.org/10.1038/s41597-023-02251-7 )
Case 2. Triploid Genome – Three Peaks
Example: Meloidogyne enterolobii (rootknot nematode)
-
Genome size: 89.57 Mb
-
Heterozygosity: 0.935%
-
Repeat content: 38.1%
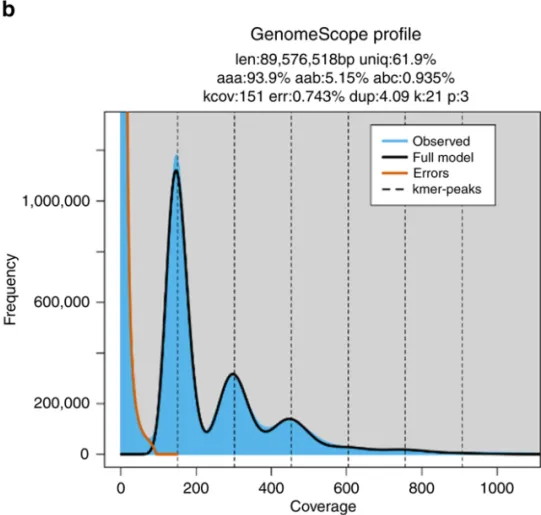
Figure 4. Triploid k‑mer plot of Meloidogyne enterolobii (k=25).
(source: https://doi.org/10.1038/s41467-020-14998-3 )
Case 3. Tetraploid Genomes – Allotetraploid vs Autotetraploid
-
Allotetraploid(e.g. Gossypium barbadense, seaisland cotton): peak pattern shows aaab < aabb
-
Autotetraploid(e.g. Solanum tuberosum, potato): aaab > aabb
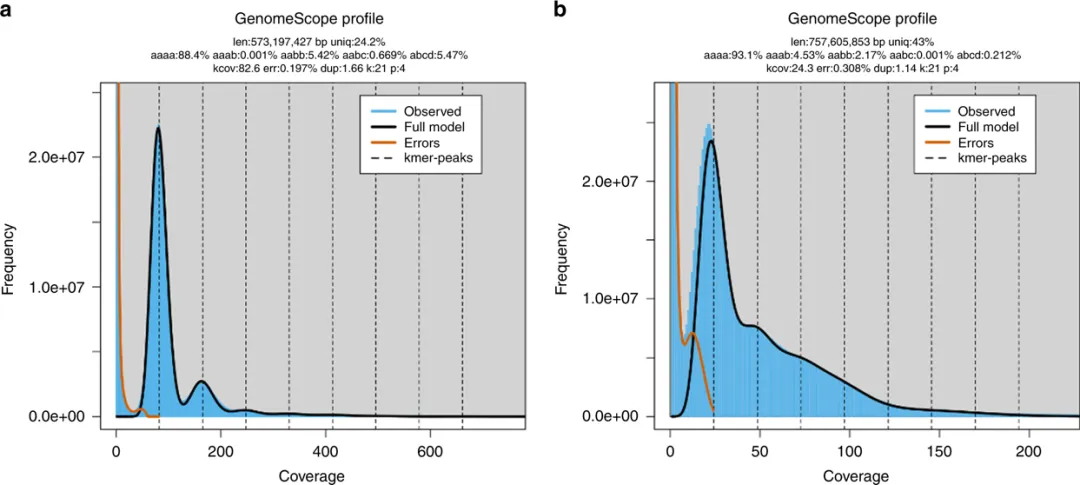
Figure 5. K‑mer plots of allotetraploid Gossypium barbadense and autotetraploid Solanum tuberosum (k=21).
(source: https://doi.org/10.1038/s41467-020-14998-3)
Case 4. Hexaploid Genome – Broad, Complex Distribution
Example: Triticum aestivum (bread wheat)
Multiple overlapping peaks with a wide frequency range, reflecting high complexity.
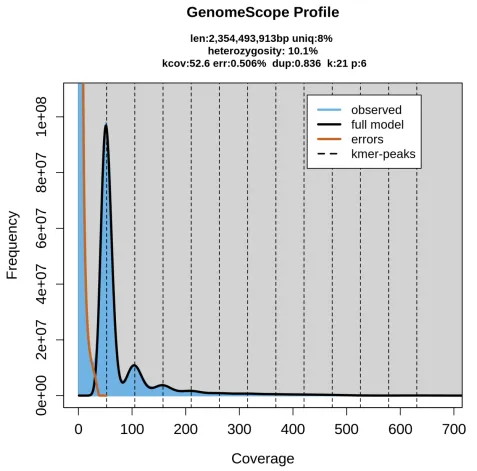
Figure 6. Hexaploid k‑mer plot of Triticum aestivum (k=21).
(source: https://doi.org/10.1038/s41467-020-14998-3)
Note: If your k-mer plot looks messy or suggests polyploidy, do not rely solely on GenomeScope2. We recommend smudgeplot or PloidyFrost for more accurate ploidy inference (see next section).
5. Contamination & Polyploid Handling
a.Sample Contamination Assessment
Before interpreting kmer results, you must verify sample purity.
-
Method:Map reads against the NT database (NCBI)
-
Threshold:If contamination > 5% (bacteria, fungi, nontarget DNA), reprepare the sample and resequence.
-
Our survey service includes contamination screening by default.
-
How to Handle a Polyploid Genome?
When the kmer plot suggests polyploidy but there is no literature support, follow a twostep strategy:
|
Step |
Method |
Output |
|
Computational prediction |
smudgeplot / PloidyFrost on the same kmer data |
Ploidy estimate (triploid, autotetraploid, etc.) |
|
Experimental validation |
Flow cytometry + karyotyping |
Cytological confirmation |
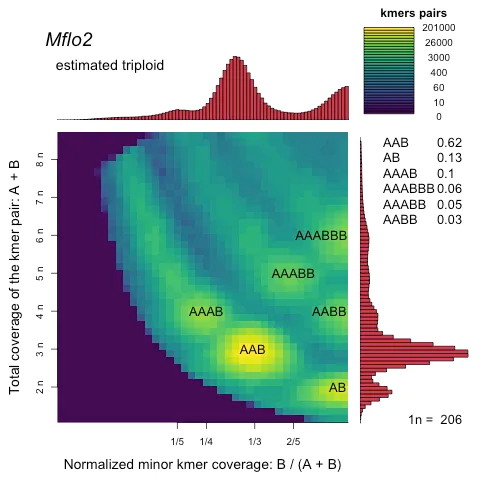
Figure 7. Example of smudgeplot output for ploidy inference.
(source: https://github.com/KamilSJaron/smudgeplot)
We can help design a combined “sequencing + cytogenetic validation” package to ensure your assembly strategy is correct.
6. Frequently Asked Questions (FAQ)
Q1: How exactly are genome size, heterozygosity and repeat content calculated from kmers?
A:
-
Genome size≈ (total number of distinct kmers) / (mean kmer coverage)
-
Heterozygosity≈ (heterozygous kmers) / (total kmers) – visible as a secondary peak in the histogram
-
Repeat content= 1 – (unique kmers / total kmers)
These calculations are built into tools like GenomeScope2 and GCE, so you don’t need to compute them manually.
Q2: Can different software (GCE vs GenomeScope2) give different results?
A: Yes, because they use different statistical models. We recommend:
-
Run both tools and compare results
-
Visually inspect the raw kmer histogram to locate the main peak
-
If needed, calibrate with flow cytometry data
Q3: My kmer plot looks like a polyploid but there is no literature support, what should I do?
A:
-
Run smudgeplotfor a computational prediction
-
If still uncertain, perform flow cytometryand chromosome counting
-
Use the experimental results to constrain your software parameters
Q4: How do I remove contamination effects from kmer analysis?
A: Use strict quality trimming (fastp or Trimmomatic) and map to a contaminant database. If contamination >5%, do not proceed – repurify the sample and resequence.
Q5: How to choose kmer length? Why is it usually odd?
A:
-
For most animals and plants: k=19(long enough to avoid most sequencing errors, short enough to cover unique regions)
-
Adjustable range: 17, 19, 21
-
Odd kprevents a kmer from being its own reverse complement and allows a clear central base – important for many alignment algorithms.
7.Our Service Package: OneStop Genome Survey Analysis
We offer a standardised Genome Survey Service that saves you time and effort:
|
Service Component |
Description |
|
DNA extraction & QC |
Ensure sample quality |
|
Shortread sequencing |
Illumina / DNBSEQ, 30–50×, pairedend 150 bp |
|
Standard kmer analysis |
Dual software: GenomeScope2 + GCE |
|
Contamination screening |
NT database alignment; alert if >5% contamination |
|
Ploidy inference |
Smudgeplot added if needed |
|
Final report |
Genome size, heterozygosity, repeat content, recommended assembly strategy |
|
Optional addons |
Flow cytometry, karyotyping (additional turnaround) |
Turnaround time: 2–3 weeks (from sample receipt to report)
Delivery format: PDF report + optional raw data
Related Services
Reference:
-
Gomes-Dos-Santos A, et al. PacBio Hi-Fi genome assembly of the Iberian dolphin freshwater mussel Unio delphinus Spengler, 1793. Sci Data. 2023.
-
Ranallo-Benavidez TR, et al. GenomeScope 2.0 and Smudgeplot for reference-free profiling of polyploid genomes. Nat Commun. 2020.

Contact Us
If you are interested in our long-read sequencing services or potential collaboration, please contact us. Our team is ready to support your research with tailored solutions. We also welcome feedback from users to help us improve our services.

Contact Us
Add: One Innovation Drive, Suite B3-406, Worcester, MA 01605, USA
在线客服添加返回顶部
右侧在线客服样式 1,2,3 1
图片alt标题设置: SAILGENE TECHNOLOGY INC.
表单验证提示文本: Content cannot be empty!
循环体没有内容时: Sorry,no matching items were found.
CSS / JS 文件放置地